Chris made an oil and vinaigrette potato salad (steamed potatoes (sliced before steaming), green onions, olive oil, mustard, vinegar, salt and pepper) for Fathers Day. With the leftovers, she made a 'Spanish Tortilla"
To give you an idea of quantities, here is the list of ingredients for a Spanish Tortilla posted on the NY Times website:
INGREDIENTS
1-1/4 lbs. potatoes
1 each onion
8 each eggs
1/4 cup olive oil
Chris used her leftover potato salad, in which the potatoes had already been cooked. The quantity was enough to fill the pie plate as shown above. Here is her process:
PROCESS
Arrange potato salad in pie plate
Heat @ 325F for 20 minutes
Beat eggs with salt and pepper (quantity based on personal taste)
Pour egg mixture over potatoes and let sit for 10 to 15 minutes
Bake @ 300F for 15 to 20 minutes
CHRIS' OTHER RECIPES:
Bacon Broccoli Frittata
Wednesday, June 24, 2020
Sunday, June 21, 2020
USA COVID-19 Cases and Deaths by Age
Using data from CDC's Provisional COVID-19 Death Counts by Sex, Age, and State and COVID Data Tracker (CDC publishes a weekly update on Wednesdays and the data date is shown on the graph.
Number of people by age group who have contracted and died from COVID-19
Number of people by age group who have contracted and died from COVID-19
| Age group | Population | Cases | Cases per 100,000 age group population | Deaths | Deaths per 100,000 age group population |
| 0-17 | 73,776,684 | 4,023,705 | 5,454 | 532 | 0.7 |
| 18-44 | 117,055,222 | 11,993,200 | 10,246 | 16,018 | 14 |
| 45-64 | 83,904,335 | 7,519,955 | 8,963 | 106,345 | 127 |
| 65-74 | 30,492,316 | 2,023,133 | 6,635 | 132,992 | 436 |
| 75+ | 21,938,877 | 1,648,079 | 7,512 | 340,853 | 1,554 |
| TOTALS: | 327,167,434 | 27,208,072 | 596,740 |
COVID-19 case and death percentages in tabular form:
| Age group | % of Population | % of total cases | % of total deaths | % death / age group cases |
| 0-17 | 22.6% | 14.8% | 0.1% | 0.01% |
| 18-44 | 35.8% | 44.1% | 2.7% | 0.1% |
| 45-64 | 25.6% | 27.6% | 17.8% | 1.4% |
| 65-74 | 9.3% | 7.4% | 22.3% | 6.6% |
| 75+ | 6.7% | 6.1% | 57.1% | 20.7% |
| TOTALS: | 100.0% | 100.0% | 100.0% |
One of the issues that has been raised during the pandemic is how to determine the 'true' number of people that have had COVID-19 and, consequently, how many have died from the disease. The BBC has published an article, Coronavirus, What is the true death toll of the pandemic?, which illustrates this conundrum.
 |
| BBC graph showing the reported Coronavirus deaths and "excess" deaths. |
Here is the CDC's analysis of data illustrating excess deaths due to COVID-19 : |
 |
| Graph used in Excess Deaths Associated with COVID-19 |
Monday, June 15, 2020
ANIMATION: elongated inbetweens
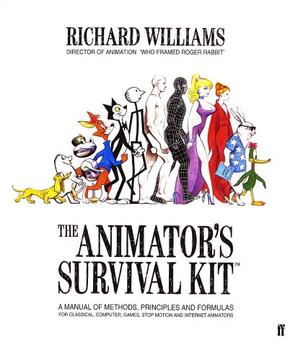
On page 96 of his book, The Animator's Survival Kit, Richard Willams introduces elongated inbetweens. The pounding on a door is one example he uses. In addition to including an elongated inbetween (Drawing 2, below), he also includes a couple of different timings for the animation.
Here are the three drawings used:
The elongated inbetween is included in the next animation and it and the extremes are shot on ones:
The last animation, the inbetweens are shot on ones; the extremes are shot on twos:
Here are the three drawings used:
Here is the animation included the two extremes (Drawings 1 and 3) shot on twos:
 |
| Drawings 13 13 13 |
 |
| Drawings 123 123 123 |
 |
| Drawings 1 23 21 23 21 23 2 |
early animations
Here are the beginnings, hopefully, of my journey into animation. They were inspired by Marisa Lewis' facebook group, Daily Sketching Workout (DSW).
 |
| DSW: a creature that only eats . . . |
 |
| DSW: a waterproof outfit |
 |
| DSW: finding a coded message |
 |
| DSW: a letter sealed with wax |
 |
| DSW: optical illusion |
Doing these has made me aware of how little I know about animation, so I'm endeavoring to read Richard Williams' book, The Animator's Survival Kit.
Subscribe to:
Posts (Atom)


