Using data from CDC's
Provisional COVID-19 Death Counts by Sex, Age, and State and
COVID Data Tracker (CDC publishes a weekly update on Wednesdays and the data date is shown on the graph.
Number of people by age group who have contracted and died from COVID-19
| Age group | Population | Cases | Cases per 100,000 age group population | Deaths | Deaths per 100,000 age group population |
| 0-17 | 73,776,684 | 4,023,705 | 5,454 | 532 | 0.7 |
| 18-44 | 117,055,222 | 11,993,200 | 10,246 | 16,018 | 14 |
| 45-64 | 83,904,335 | 7,519,955 | 8,963 | 106,345 | 127 |
| 65-74 | 30,492,316 | 2,023,133 | 6,635 | 132,992 | 436 |
| 75+ | 21,938,877 | 1,648,079 | 7,512 | 340,853 | 1,554 |
| | | | | |
| TOTALS: | 327,167,434 | 27,208,072 | | 596,740 |
COVID-19 case and death percentages in tabular form:
| Age group | % of Population | % of total cases | % of total deaths | % death / age group cases |
| 0-17 | 22.6% | 14.8% | 0.1% | 0.01% |
| 18-44 | 35.8% | 44.1% | 2.7% | 0.1% |
| 45-64 | 25.6% | 27.6% | 17.8% | 1.4% |
| 65-74 | 9.3% | 7.4% | 22.3% | 6.6% |
| 75+ | 6.7% | 6.1% | 57.1% | 20.7% |
| | | | |
| TOTALS: | 100.0% | 100.0% | 100.0% |
One of the issues that has been raised during the pandemic is how to determine the 'true' number of people that have had COVID-19 and, consequently, how many have died from the disease. The BBC has published an article,
Coronavirus, What is the true death toll of the pandemic?, which illustrates this conundrum.
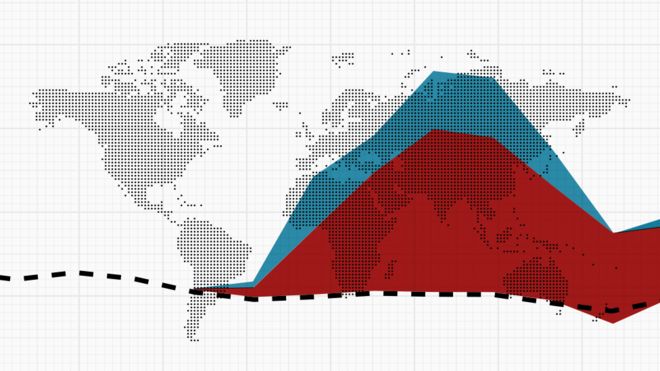 |
BBC graph showing the reported Coronavirus deaths and "excess" deaths.
|

No comments:
Post a Comment